


vPlan AI is in beta -> Sign up now
If you want to plan ahead, you need to be able to look back. With vPlan’s analysis view, you make your data clear through insightful charts, tables and dashboards. You can see where your team stands, how much capacity you still have, and where optimisation is possible. This way, you base your decisions on facts.


With the analysis view, you quickly gain insight into time tracking and capacity per team member. In clear pie- and bar charts, you can instantly see how your team is performing and where there’s room in the planning.

What was planned and what was actually done? At a glance, you can see the difference between the estimate and the actuals, and adjust where needed.

Use the list view to dive deep into the details. View results by process step or project, filter by period and easily export all data to Excel.

Want real control over your figures? Use the formula functionality to perform specific calculations based on your data. Need help? The AI assistant helps you create smart, customised formulas.

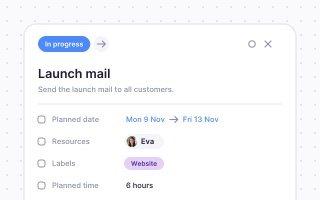
Plan, assign and follow up every task in one place.
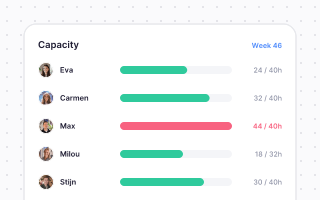
See who has room and plan around real availability.
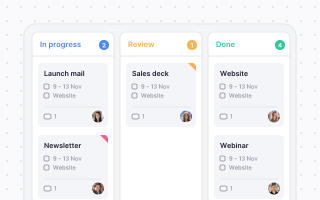
Switch between timeline, kanban, list and calendar.
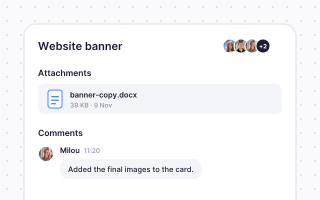
Comments, files and updates right where the work is.
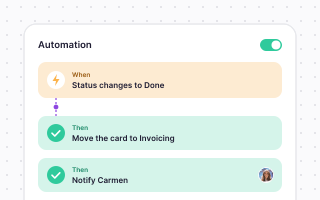
Let smart rules take over the repetitive work.
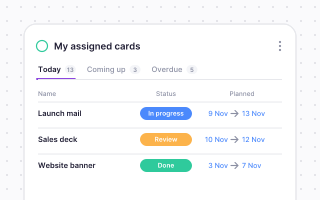
Live insight into progress, hours and bottlenecks.
Planning that works doesn't have to be a challenge. With vPlan, you work smarter, not harder. From simple workflows to real-time collaboration.


“We know exactly what we’re working on, what’s already been done, and what still needs to happen.”

Marnique Assink
Marketing coordinator, Farm Food

Wilco de Moet
Smits Vastgoedzorg

“Without vPlan, we wouldn't have been able to grow so fast.”

“Everyone accesses the same information, which strengthens collaboration and helps prevent errors.”

Stephan
Financial director, Vredehof
“vPlan gives us a clear overview, allowing us to respond quickly and work more productively.”

Romy Groot Obbink
Site producer, Absolutely Fresh

Marten van Ruitenburg
Fraanje

“We now have one central place where everything comes together. It provides not only clarity, but also peace of mind.”

“Standard processes can now be adapted to specific needs without customization, which increases efficiency and improves collaboration.”

Thomas Brunink
Operations Manager, Brunink Group
Rob Detert Oude Weme
DDJ
“We don't guess anymore; we know exactly what we can deliver.”